This application supports the following indicators:
Bullish Technical Indicators:
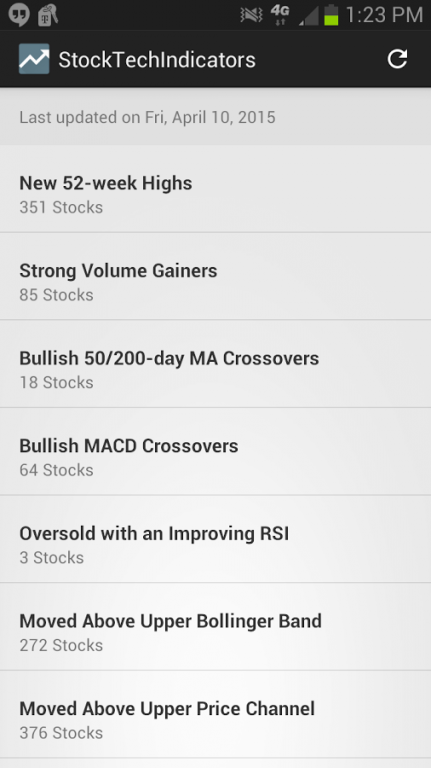
• New 52-week Highs
• Strong Volume Gainers
• Bullish 50/200-day MA Crossovers
• Bullish MACD Crossovers
• Oversold with an Improving RSI
• Moved Above Upper Bollinger Band
• Moved Above Upper Price Channel
• Moved Above Upper Keltner Channel
• Improving Chaikin Money Flow
• New CCI Buy Signals
• Parabolic SAR Buy Signals
• Stocks in a New Uptrend (Aroon)
• Stocks in a New Uptrend (ADX)
• Gap Ups
• Breakaway Gap Ups
• Runaway Gap Ups
• Island Bottoms
Bearish Technical Indicators:
• New 52-week Lows
• Strong Volume Decliners
• Bearish 50/200-day MA Crossovers
• Bearish MACD Crossovers
• Overbought with a Declining RSI
• Moved Below Lower Bollinger Band
• Moved Below Lower Price Channel
• Moved Below Lower Keltner Channel
• Declining Chaikin Money Flow
• New CCI Sell Signals
• Parabolic SAR Sell Signals
• Stocks in a New Downtrend (Aroon)
• Stocks in a New Downtrend (ADX)
• Gap Downs
• Breakaway Gap Downs
• Runaway Gap Downs
• Island Tops
Candlestick Patterns:
• Bullish Engulfing
• Piercing Line
• Morning Star
• Bullish Harami
• Three White Soldiers
• Bearish Engulfing
• Dark Cloud Cover
• Evening Star
• Bearish Harami
• Three Black Crows
• Rising Three Methods
• Falling Three Methods
• Dragonfly Doji
• Gravestone Doji
• Hammer
• Shooting Star
• Filled Black Candles
• Hollow Red Candles
• Elder Bar Turned Red
• Elder Bar Turned Blue
• Elder Bar Turned Green
• Entered Ichimoku Cloud
• Moved Above Ichimoku Cloud
• Moved Below Ichimoku Cloud
• Ichimoku Cloud Turned Green
• Ichimoku Cloud Turned Red
P&F Patterns:
• P&F Triple Top Breakout
• P&F Spread Triple Top Breakout
• P&F Ascending Triple Top Breakout
• P&F Quadruple Top Breakout
• P&F Bearish Signal Reversal
• P&F Bear Trap
• P&F Bullish Catapult
• P&F Bullish Triangle
• P&F Low Pole
• P&F Triple Bottom Breakdown
• P&F Spread Triple Bottom Breakdown
• P&F Descending Triple Bottom Breakdown
• P&F Quadruple Bottom Breakdown
• P&F Bullish Signal Reversal
• P&F Bull Trap
• P&F Bearish Catapult
• P&F Bearish Triangle
• P&F High Pole
• P&F Long Tail Down
We do not host Stock Tech Indicators on our servers. We did not scan it for viruses, adware, spyware or other type of malware. This app is hosted by Galad and passed their terms and conditions to be listed there. We recommend caution when installing it.
The APK Download link for Stock Tech Indicators is provided to you by apps112.com without any warranties, representations or guarantees of any kind, so access it at your own risk.
If you have questions regarding this particular app contact the publisher directly. For questions about the functionalities of apps112.com contact us.

|
| ||||
| Downloads: 90 | ||||
| Updated At: 2024-04-23 10:11:42 | ||||
| Publisher: Etherby | ||||
| Operating System: Android | ||||
| License Type: Free |